J.D. Power has released the results of the 2007 version of their Initial Quality Study (IQS). This study surveys car owners about problems esperienced during the first 90 days of ownership. As in the past, it is important to look beyond who won to what is being measured and the size of the differences. With these things understood, J.D.’s latest results are interesting.
First, what is being measured? As discussed last year, the IQS combines two totally different types of problems: “design defects” and “production defects.” The latter are reliability issues as TrueDelta understands them. The former are designed-in annoyances that cannot be fixed, but can only be endured. The most famous of these is BMW’s difficult to understand and operate iDrive system.
If “design defects” were not included, all of the problem rates would be much lower.
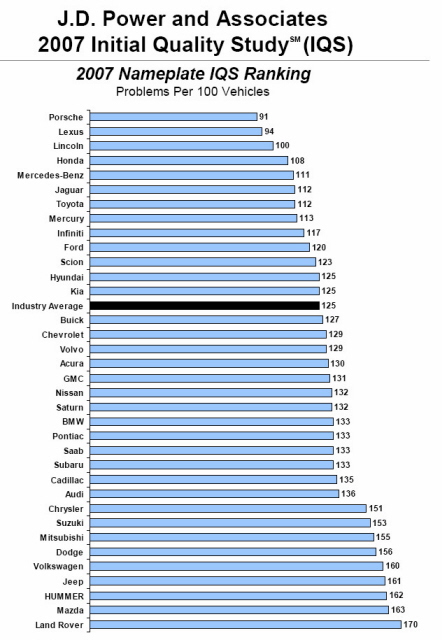
Even with poorly functioning cupholders and such included, the differences are generally small. Even more than last year, most brands don’t differ much. The average this year is 125 problems per 100 vehicles. Note, again, that problem rates are much higher than repair rates, as many problems as defined by JD cannot be fixed. Even so, two-thirds of brands fall within a sixth of a problem per car of this average. Put another way, the distance from #4 Honda (108 PPH) to #27 Audi (136 PPH) is less than one-third of a problem per car.
How much emphasis should be placed on a single extra problem for every three or four cars, especially when about half of these problems are design issues?
These huge caveats stated, the 2007 IQS does have some interesting results. Ford did very well in many segments. This doesn’t surprise me, as 2006 and newer Ford cars have had low repair rates in TrueDelta’s Vehicle Reliability Survey. Repair rates for the Ford Five Hundred and Ford Freestyle dropped substantially from the 2005s to the 2006s. J.D. Powers also reports that Mercedes has improved a great deal, moving from 25th last year to 5th this year.
And Land Rover has improved most of all. Though still last, with 170 problems per 100 vehicles, the Ford-owned British SUV manufacturer is no longer way behind other brands. As a result, the difference between the best and worst is now much less than a problem per car (79 per 100 to be exact). In past years the few brands near the bottom were much worse than the others. This is no longer the case.
Partly as a result of improvements by the least reliable brands, Mazda is now in next to last place, with 163 problems per 100 vehicles. I’ve seen high repair rates with some new Mazda models, but the samples have been way too small to be conclusive. I hope to have some results for these models in the next update, which will be posted in August. I’ve been assuming that the high repair rates for these new Mazdas might be a fluke caused by the very small sample sizes, but maybe not.
So are Mazdas bad cars? Not at all. Some have very low repair rates. The Mazda3 has been doing very well in TrueDelta’s survey. And the MX-5 Miata is the best in its segment in the IQS. Problem is, some models scored badly enough to drag the average down. With the scores so close together, it doesn’t take much. It would make no sense to avoid all Mazdas because a few new models have higher than average problem rates.
The most important thing to realize about J.D. Power’s results could well be that brand-level scores aren’t very useful. The differences between models within a brand are usually going to larger than the differences between brands. So you could easily end up with a less reliable model by opting for one of the top-scoring brands. I’ve often wondered how many people bought a Nissan Quest, one of the least reliable cars out there, because of the brand’s reputation.
Unfortunately, J.D. Power only publicly releases numerical results at the brand level. They provide dot ratings for models, but then you can’t tell how large the difference is between models. Often, as TrueDelta’s research will publicly reveal, this hidden difference will be a fraction of a problem per car. Are you really going to go with your second or third choice to avoid a third or even two-thirds of a problem?