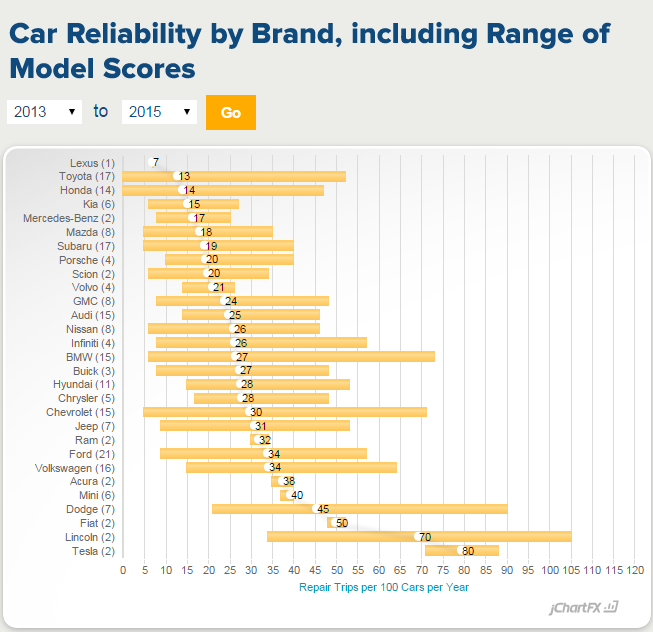
In a recent blog entry, I listed some reasons TrueDelta’s reliability results can differ from those in Consumer Reports. But how much do our rankings of brand actually differ? In instances where they do differ, what is the likely cause?
Consumer Reports bases its brand rankings on the most recent three model years. On TrueDelta, you can specify which model years to base the ranking on. To compare our results with CR’s, I’ve selected 2013-2015.
First, the similarities. Lexus, Toyota, Kia, Mazda, and Subaru rank near the top in both surveys. Porsche, Volvo, Nissan, BMW, and Hyundai rank near the average in both surveys. (In TrueDelta’s stats, the average 2013-2015 model requires 25 repair trips per 100 cars per year.) Jeep, Ram, Ford, Lincoln, Acura, Dodge, Fiat, and Tesla rank near the bottom in both surveys (though Tesla isn’t as far from the average in their survey as it is in ours).
We don’t have sufficient sample sizes for any recent Cadillacs. But based on the data we do have, Cadillac would be worse than average in our survey as well as theirs.
Now, the differences.
Hondas score much better in our survey than CR’s. I believe this is because many of the problems reported on CR’s survey involve Honda’s infotainment system, and these are either not fixable (they’re design flaws) or they’re fixable with software. We wouldn’t count these problems in either case.
The same also appears to be the case with Infiniti, but largely involves one model, the Q50 sedan, so the impact on the brand average is lower. Infiniti scores about average in our survey, and well below average in CR’s.
Mercedes-Benz ranks much higher in our survey than in CR’s. This is most likely because they had enough data for six models, while we only had enough data for two, and these two didn’t include the new S-Class or the CLA. The data we do have for the CLA suggests that it is worse than average.
Lincoln is below average in both surveys, but is much lower in ours. This is because we only have sufficient data for two models, and one of the two is the new MKC, which has been troublesome.
For similar reasons, Buick is better than average in CR, but about average in our ranking. We haven’t had sufficient sample sizes for most Buick models. If we included those for which we have partial data, Buick would also be above average in our ranking.
On the other hand, Chevrolet and GMC fare much better in our survey than CR’s. The big difference appears to be with the new pickups and large SUVs. We don’t yet have enough data on the new midsize pickups, but what we do have suggests they’re worse than average. The large pickups and large SUVs, though, have fared far better in our results than in CR’s. Two commonly reported problems could be responsible: shuddering in the new 8-speed automatic transmission, and driver seats prone to shifting when accelerating and braking. A shim kit has been developed to fix the latter, but it’s possible that many owners haven’t had this fix performed yet (CR counts owner-perceived problems, we count completed repairs to be extra-sure there was a problem). The fix for the transmission is updated software, so we would not count these cases.
Chrysler ranks higher in our survey because many of the problems with its latest cars involve transmission and infotainment system software. Dodge, Jeep, and Fiat score even worse in CR’s survey than in ours due to the same factor. But they’re near the bottom in ours even without counting software-related problems.
Audi ranks third in CR’s survey, while it is exactly average in ours. Owner satisfaction could be providing Audi with a boost in CR’s survey. Satisfied owners are less likely to consider a problem serious, and are therefore less likely to report it on CR’s survey. This factor has dramatically boosted Tesla in CR’s survey. This said, the Audi A4 and related models have been doing very well in our survey. We count these as one model. CR might count them as multiple models when calculating the brand score.
Volkswagen and Mini rank about average in CR’s survey but below average in ours. There’s no obvious explanation. The owner satisfaction factor again? Benefiting from low expectations given how much worse both used to be?
Overall the ranks are more similar than different. Other than Mercedes-Benz, which can be attributed to our lack of coverage, no brand is significantly above the average on one list and significantly below the average on the other.

