Over the years we’ve added so many different ways to view TrueDelta’s car reliability information that some have flown under members’ radar. Maybe it would help to have a recap?
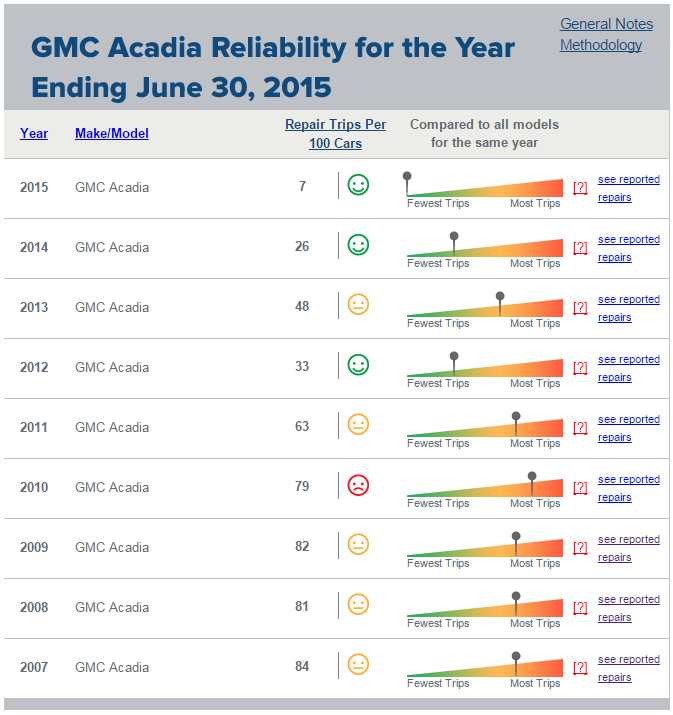
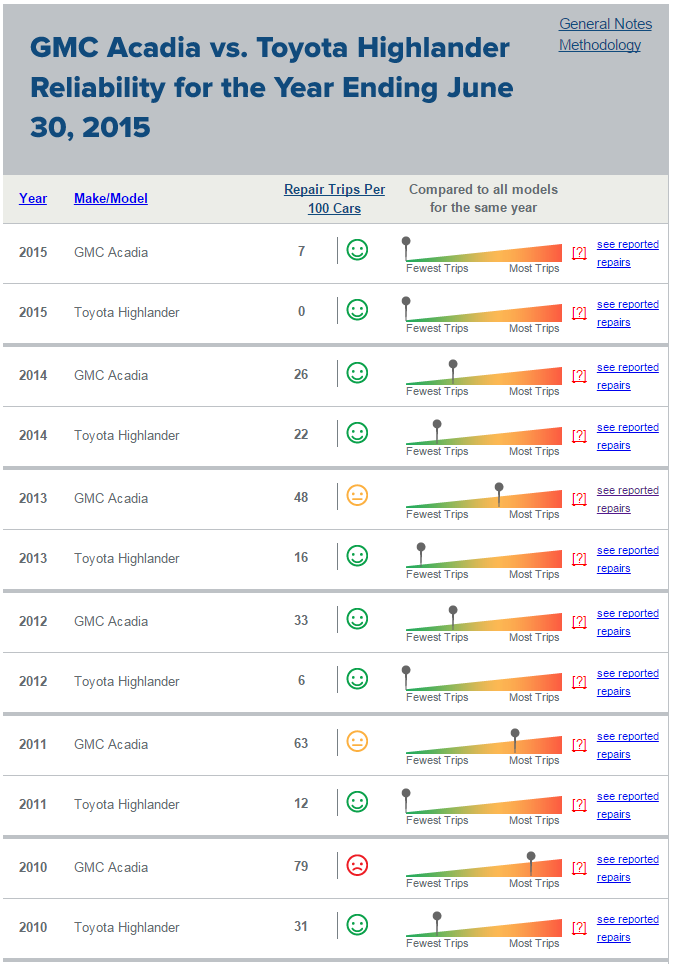
We started with the number of successfully completed repair trips per year, calculated per 100 cars to remove the decimal.
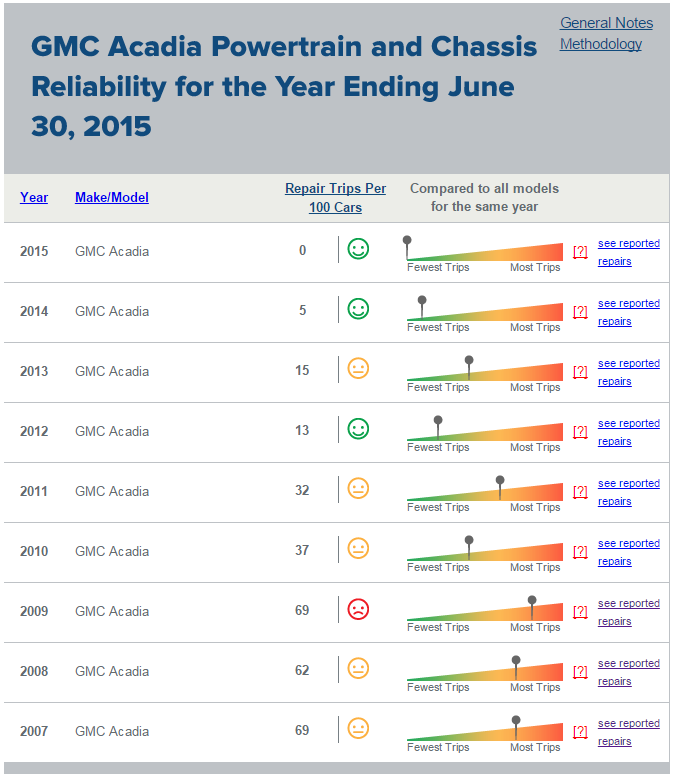
Some people want to focus on problems that can potentially render the car undriveable, so we post the number of powertrain and chassis repairs per 100 cars per year. (One wrinkle: some minor chassis problems are excluded.) Such repairs increase from only about one-third of the total during the first year of ownership to about three-quarters of the total once cars are over eight years old.
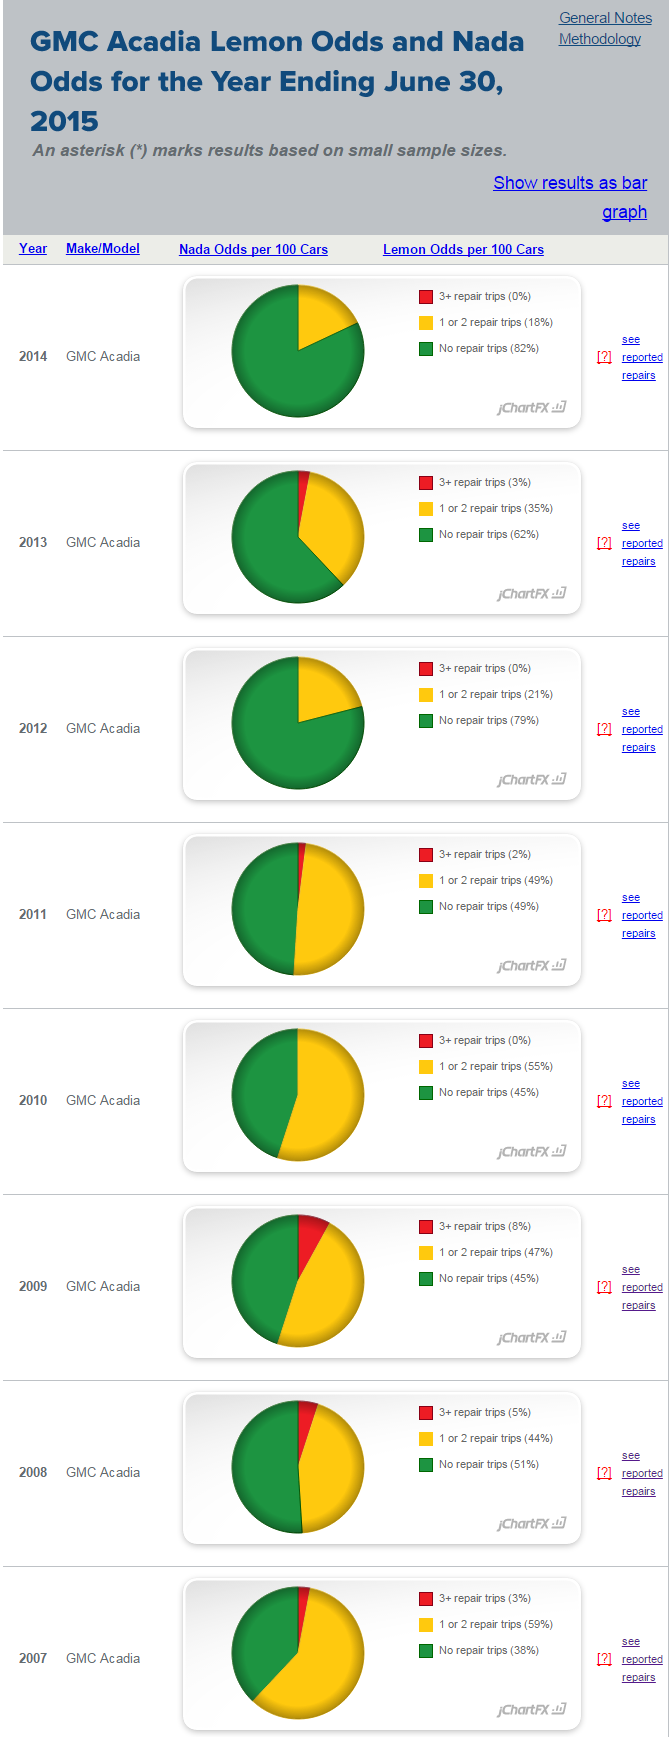
Both of the above stats are averages. They suggest how many repairs the typical car required–generally less, even much less, than one per year–but not what percentage of cars required many repairs or the percentage that required no repairs at all. Since many car buyers (whether they realize it or, as our traffic stats suggest, not) really want to know their chances of getting a really good car or a really bad one, some time ago we added the “nada odds” and “lemon odds” stats, for both all repairs and for powertrain-and-chassis repairs.
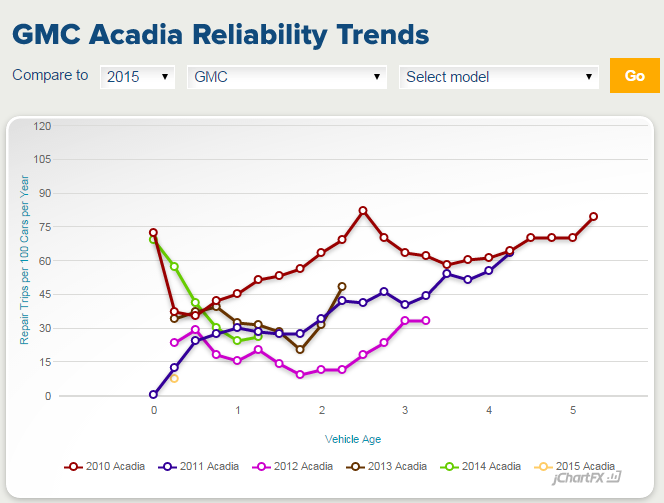
It can be informative to know whether the repair frequency of a car has been increasing or decreasing. Sometimes a common problem pops up that produces a temporary blip. To convey this information, we added reliability trends graphs (only for recent model years and the overall repair frequency so far, we’ll be expanding this feature).
Each of the above can also be displayed as a comparison between models.
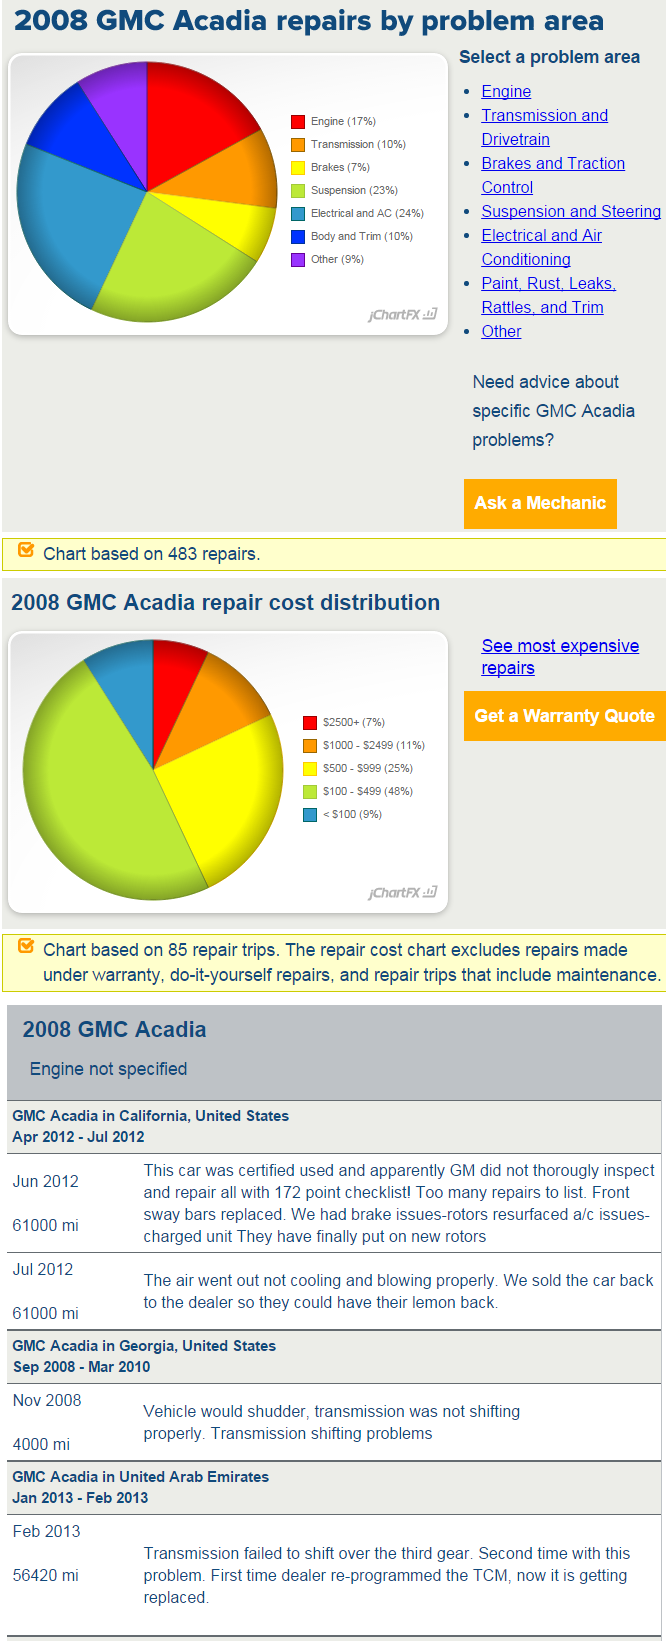
Finally, it can be informative to view the repairs behind the stats. So each stat (other than the trends pages) includes a link to view the descriptions of all reported repairs. These pages include pie charts that categorize repairs by problem area and by cost. These charts are based on all repairs reported ever. (I’d like to add similar charts that only include the repairs included in the current stats, but our to-do list is lengthy.)
Our data could be sliced other ways as well, but the most appealing of these (such as splitting the sample by miles driven, and trying the separate out the effects of age and miles) would require larger sample sizes than we tend to have. The solution: get more car owners involved. We’re working on this, and hope our members will as well 🙂