When we first developed the formulas for graphically representing TrueDelta’s car reliability stats, we had far less data. We had to rely on cars with small sample sizes to get an idea of the breadth of the range from “fewest repair trips” to “most repair trips.”
 We thoroughly revisited these calculations with the latest update. This time around, with more data to work with, we entirely ignored models for which we have fewer than 25 responses. The larger the sample size, the lower the possibility of extreme numbers, and highest “repair trips per year” stat for a given model year was much lower. The resulting formulas have a much smaller range from “fewest” to “most.”
We don’t balance the scale strictly about an average, because the intent is to give cars unlikely to have problems a “happy face” and reserve the “unhappy face” for models that are clearly troublesome. Put another way, as the average continues to improve we wouldn’t want to force bad ratings on cars that were actually fairly reliable in absolute (if not relative) terms. Keeping the old scale with the new formula yielded some overly conservative faces–the lower limits for the yellow and red faces seemed too low.
To counteract this, we shifted the divisions a point to the right on the eleven-point scale. Previously, the first three points were green, the next four yellow, and the last four red. This made sense as outliers had distended the “most repairs” end. With the new, compressed scale, we now have four green, four yellow, and three red.
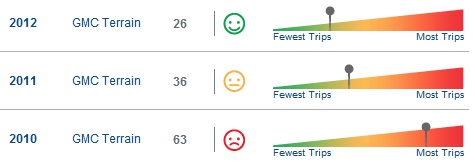
Even with the shift, some scores that would have been green earlier are now yellow, and some that were yellow are now red. In the GMC Terrain example shown, both the 2010 and 2011 are so affected. Even so, reds remain uncommon. Few recent car models have proved to be troublesome, and we intend for the scales and faces to reflect this.