 People sometimes find the breadth and depth of TrueDelta’s car reliability information overwhelming. Even those that don’t often want a quick snapshot of how a model has been faring over multiple model years. For both purposes we decided to add car reliability stats by model generation.
What’s a model generation? When a car model receives a significant update, it begins a new generation. As in every case save “reliability trends,” the new specs are based on survey responses over the past four quarters.
For various reasons, it makes sense to represent reliability by generation in terms of a percentage of the average (for the model years included in the calculation, so 2008, 2009, 2010, 2011, and 2012 for the 2008-2012 Buick Enclave) rather than as an actual repair frequency (which will continue to be displayed when viewing reliability by model year).
This presented a new problem: our green-yellow-red eleven-point scales have been based on minimums and maximums rather than averages. There were good reasons for this, including that the distribution of stats around the average changes as cars age. But scales based on the average would be clearer, and would make more sense when comparing generations. So we’ve developed new continuous scales based on the average repair frequencies for the model years in question.
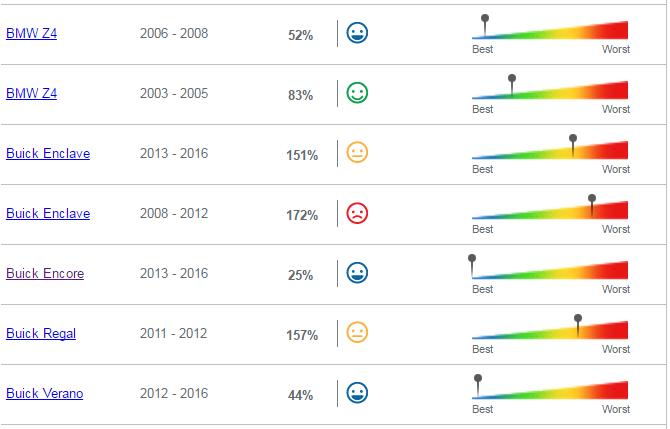
At the same time, we’ve added a fourth, blue, extra-happy face. Before we had a green face that roughly equaled better than average, a yellow face for worse than average, and a red face for much worse than average. The new faces are more precise:
Blue very happy: up to 75% of the average
Green happy: from 75% to 125% of the average (“about average”)
Yellow without expression: from 125% to 162.5% of the average
Red unhappy: over 162.5% of the average (rare)
The new continuous (no fixed points) scale runs from 37.5% to 212.5% of the average. This puts the split between green and yellow at the midpoint. Plus few models exceed either extreme. Those that do are either very good or very bad.
This said, as cars age and the average increases (from about 25 repair trips per 100 vehicles per year for nearly new cars to about 80 repair trips per 100 vehicles per year for those over a decade old) it becomes more common to peg the “very good” end of the scale and less common to peg the “very bad” end of the scale.
You’ll find a link to car reliability stats by model generation on the car reliability home page, below the menus.