CR: new transmissions, infotainment systems are key sources of problems

Consumer Reports released their updated reliability ratings today in a presentation to the Detroit-based Automotive Press Association (APA). Their presentation highlighted infotainment systems and new transmission designs as key sources of problems in recently redesigned cars. Problems with both are often resolved with software updates. But in the case of new transmissions, all too often hardware and even the entire transmission must be replaced.

ZF_9HP
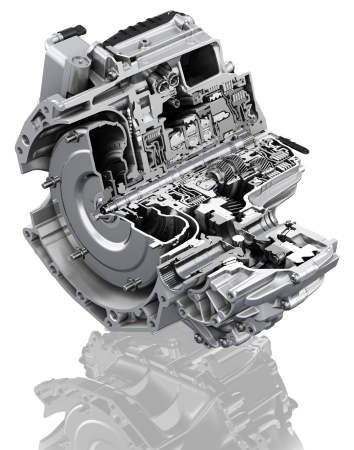
Transmissions identified as especially trouble-prone include the nine-speed ZF automatic transmission (used in some Chryslers, Jeeps, Fiats, Hondas, Acuras, and Land Rovers), the six-speed dual-clutch automated manual transmission (DCT) used in the Ford Fiesta and Focus, the eight-speed DCT used in the Acura ILX and TLX, and the continuously variable transmission (CVT) used in the latest Nissan Altima, Pathfinder, and Infiniti QX60. If these transmissions remain unreliable after the warranties end, the cars with them will be especially bad bets as used cars. A while ago I personally stopped recommending the Ford Fiesta and Focus to anyone buying an automatic, and major repairs to the DCTs in these have been climbing based on responses to TrueDelta’s survey. In contrast, problems with the ZF nine-speed automatic might have peaked last spring, and its reliability could improve in the future. Or not.

Looking at reliability by brand, Consumer Reports once again singled out Fiat Chrysler Automobiles (FCA), with the Fiat brand “off the charts” with reliability 177 percent worse than the average and Jeep, Ram, Dodge, and Chrysler also at the bottom. The Fiat 500L was the least reliable car model. Lexus and Toyota were the two most reliable brands, followed by Audi (much better than a few years ago) and Mazda. I find Mazda’s performance (in our surveys as well as CR’s) especially impressive because they completely redesigned their cars and powertrains (including transmissions) during the model years in question.

The full ranking (except for Tesla, which would have been between Acura and GMC with a -43):

CR brand ranking

Where TrueDelta’s rankings differ from CR’s, one of three factors is usually responsible:

1. We ask people to report all repairs, not just problems they “considered serious.” The latter approach yields a blend of reliability, satisfaction with the car, and satisfaction with dealer service. Cars with high owner satisfaction tend to rank higher in CR’s results.

2. We exclude repairs that are software-only. These are probably the majority of transmission and infotainment system repairs. Cars with many software-related issues tend to rank lower in CR’s results.

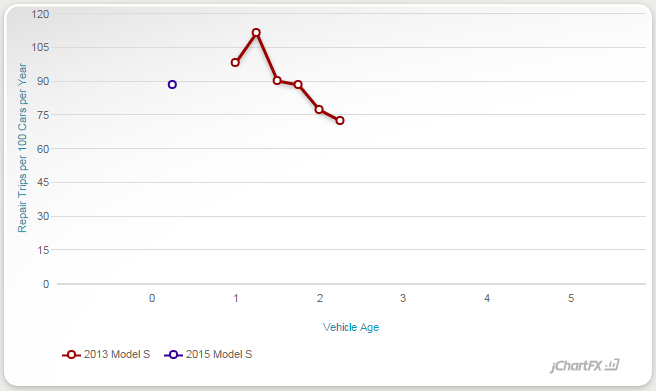
3. Over the course of the year, our results are, on average, nearly nine months ahead of CR’s. With the update, they’re only a couple months behind our current release (most recent survey in April vs. June of this year). But they won’t update again until next October while we update every three months. If a car’s reliability dramatically worsens or improves, this will be reflected sooner in our results.

Tesla Model S reliability finally below average in CR

Consumer Reports released their updated reliability ratings today in a presentation to the Detroit-based Automotive Press Association (APA). Their rating for the Tesla Model S finally (almost) agrees with what TrueDelta has been reporting for the past six quarters, and they will no longer recommend the car.

Tesla Model S front quarter showroomSpecifically, the predicted reliability for the Model S based on the 2013-2015 model years is now 43% worse than average, deep into “half-black” territory and only two percentage points short of the dreaded big black dot. In previous years the Model S has been within 20% of the average, and so “about average” and recommendable as long as the car had a good road test score. The Model S has earned outstanding road test scores, the best in the history of Consumer Reports’s testing.

In TrueDelta’s stats the Model S has long been well over twice the average repair frequency, even over three times. The difference is that we ask owners to report all repairs and not only “problems you considered serious.” Many Tesla owners, especially those who bought their cars back in 2012 and 2013, have been avid fans of the brand. They understood that this was an all-new company producing an all-new car with all-new tech, and cut Tesla a healthy amount of slack. Also, Tesla has provided outstanding service when repairs have been needed. Both factors have caused many problems that would be reported on our survey to not be reported (since they were not considered serious by owners) on the Consumer Reports survey.

However, as Tesla has had to pull more and more from the population of regular car buyers rather than early adopters, and as time elapses and people increasingly expect them to have ironed out early issues and learn what they’re doing, the “fan” factor can be expected to weaken. I believe this is why the Consumer Reports rating has changed, rather than any actual increase in the number of problems the cars have been having.

Based on TrueDelta’s data, the opposite is actually the case, but not to a large enough extent. In the past year the repair frequency of the Model S has decreased by perhaps 20 percent. Better than before, but still much worse than the average.

Tesla Model S reliability stats

What a difference a redesign can make

It’s common knowledge that the first year of a new car design can be glitchy. But sometimes a redesign greatly improves a model’s reliability.

Two cases I’ve noticed: the 2009 Murano and the 2010 Legacy / Outback each dramatically improved on the repair frequency of the previous generation.

Murano reliability

Subaru Outback reliability

(Yes, additional participation by Murano owners would be especially helpful.)

Unfortunately, the opposite can also be the case. Can you tell when the Ford Fusion was redesigned?

Ford Fusion reliability

Chevrolet Volt: twice as much as the Cruze, or not?

2016-Chevrolet-Volt

Chevrolet has redesigned the Volt, so car reviewers are once again writing about the Volt. Some will note that the Volt’s base price ($33,995) is twice as much as that of the Cruze ($16,995), though they share a platform and are about the same size. This seems like far too much to pay for the Volt’s raison d’ĂȘtre: the ability to drive about 53 miles before the gas-powered “range extender” kicks in. But does the Volt really cost twice as much to buy as the Cruze?

This is the sort of question TrueDelta’s price comparison tool was designed to answer. Among other things, our pricing includes the $7,500 federal tax credit for which Volt buyers are eligible. To take this credit directly, buyers must owe at least $7,500 in federal taxes. But there’s a way to both evade this requirement and get the credit right away rather than wait until tax time: lease the car. This tax credit eliminates nearly half of the price difference between the volt and the Cruze. Clearly it will become much more difficult to sell the Volt once the tax credit goes away, but we’re not there yet.

Some states also provide tax credits on plug-in hybrids and electric vehicles, but we don’t currently track these. If you live in such a state, remember to also factor in this amount.

Next, TrueDelta’s price comparison tool considers differences in standard equipment. Compare a base Volt to a base Cruze, and you’ll find that the former includes over $4,000 in additional standard features. Adjust for these and factor in the federal tax credit, and the difference comes to about $5,250, less than one-third the difference between the window stickers.

Of course, it’s possible to add options to both cars. Why not equip both cars with the desired features, then see what the difference is? With our tool, this is easily done using the “configure” menu near the top of the page.

A curious thing happens as soon as you add any options, even just an automatic transmission (standard on the Volt) to the Cruze: the $16,995 L trim disappears and the feature-adjusted price difference falls below $4,000. You cannot get any options on it. Given the number of people interested in a manual transmission Cruze with no options, you probably won’t find many $16,995 window stickers on Chevrolet dealer lots.

Next you’ll find that the Cruze LS isn’t offered with any options save an automatic transmission. Want alloy wheels, cruise control, or a rearview camera? While all of these are standard on the Volt, to get them on the Cruze you must step up to the LT trim level, which also includes a turbocharged 1.4-liter engine instead of a 1.8-liter engine. The the 1.4T engine is smoother, torquier, and more efficient, it bumps the price by about $700. A Cruze LT with automatic transmission and Technology Package lists for just $5,025 less than a base Volt, while still short about $1,800 in content. For example, the Volt comes standard with the latest-and-greatest headlamp tech–LEDs–while the Cruze isn’t even available with xenons. Adjust for these remaining content differences, and the difference falls to less than one-fifth the initial amount.

Maybe you also want leather upholstery, nav, a premium audio system, or blind spot warning. Whatever the configuration, once beyond a barebones Cruze the post-federal tax credit MSRP difference tends to be between five and six thousand dollars and the feature-adjusted difference tends to be between three and four thousand dollars. Not pocket change, to be sure, but far from “twice as much.” Is it worth this much to be able to drive about 53 miles on electricity? With gas prices at their current level, maybe, maybe not. But if gas prices increase again, the Volt’s additional cost will seem very reasonable.

Also, remember the tax credits offered by some states. With some of these, the Volt can even cost less than the Cruze, especially if feature differences are considered.

Updated Reliability Stats: How Are the 2015s Faring?

For the 36th consecutive time we have updated car reliability stats before the end of the quarter’s second month, covering through the end of the previous quarter (June 30, 2015, in this case). Reliability scores elsewhere are based on data about 14 months older.

Three months ago I thought I’d be reporting now that Tesla’s quality had turned a corner. Through the end of the first quarter no repairs had been reported for the latest iteration of the Model S.

Model S reliability trends 0615Well, enough 2015 Model S repairs were reported during the second quarter to bump the repair rate to about three times the average. While this might be an improvement over previous model years, it’s not enough of one. The repair frequency for the 2012-2013 has been improving, such that in the past year it has been about twice the average. Worth noting: Tesla does providing outstanding service when a repair is needed, and some glitches should be expected when buying a revolutionary car from an all-new company.

The Model S was not the most troublesome 2015 in the survey. That honor goes to the Lincoln MKC, continuing a tradition of glitchy new model launches by Ford. It was the only 2015 with a repair frequency of more than one repair trip per car. Bucking this tradition: the new Mustang, which has been nearly repair-free. The all-new aluminum-bodied F-150 pickup also seems to be requiring few repairs so far, but it’s early and the number of responses was a few short of the minimum. Let’s see how it looks next quarter. Of greater concern than first-year reliability: will those aluminum panels corrode in a few years, like the aluminum hoods on many other Fords have?

The 2014-2015 BMW i3 was the third-most-troublesome 2015 in our survey owing to a common problem with its charging module. On the other hand, the 2014-2015 Mini Hardtop was about average while the 2014-2015 BMW 2 Series was, like the Mustang, nearly repair-free.

We didn’t receive quite enough responses for the new Mercedes-Benz C-Class. The data we do have suggests a glitchy first model year, perhaps about even with the i3.

Among other cars redesigned or significantly updated for 2015…

Both the Audi A3 / S3 and the Volkswagen GTI continued to have better-than-average repair frequencies in their first model years. The Golf 1.8T isn’t faring as well in our stats, but this could be due to a small sample size–let’s see how it looks next quarter.

Though owners have complained about the behavior of the new nine-speed transmission (engineered by German company ZF), few completed repairs have been reported for the Chrysler 200. The related Jeep Cherokee is also faring pretty well in its second year. (If only the larger Jeep Grand Cherokee was as free of bugs.)

We don’t have much data on GM’s redesigned large SUVs, but what we do have suggests they’re doing pretty well. GM’s new midsize pickups…maybe not quite as well, but we need more responses for a reasonably precise stat.

Absolutely no repairs were reported for the Honda CR-V, with 37 members responding. The Accord and Civic weren’t updated for 2015, but it’s noteworthy that no repairs were reported for either for them, uh, either. The all-new Fit wasn’t quite so lucky, and wasn’t as problem-free as previous model years, but was still considerably better than the average 2015. Recent Acuras have been considerably more troublesome. Though we don’t have a sufficient sample size for the new TLX, the twenty responses we did receive suggest a worse-than-average repair frequency.

Two redesigned Hyundais, the Genesis and Sonata, continue to do well in their first model year, but not as well as they were doing in previous quarters. They’re now near the average for all 2015s–about one repair trip for every four cars in their first year.

The Porsche Macan has been requiring repairs about 50 percent more often than the average 2015, not too bad for an all-new complicated German product.

First-year reliability of the new Subaru Legacy and Outback has worsened since last quarter, but remains near the average. We had 120 responses for these. The new WRX has improved from about double the average to about 1.5 times the average. This improvement will continue if no new common problems pop up as some initial ones (sticking fuel doors, paint rubbing off the edges of the trunk) drift out of our one-year window.

Interested in some cars that weren’t redesigned for 2015, or in something older? To check the latest car reliability stats for these and other models:

Updated car reliability stats

Which high-tech features do you want in your next car?

59 technologies

A challenge I did not foresee when I first created TrueDelta’s apples-to-apples car comparison tool in 2004: the flood of high-tech, software-centric features that would emerge in the following decade. It turns out auto makers are also bewildered. Which new high-tech features will buyers demand in their next car? Which can they afford to delay or never being work on? To help, J.D. Power has conducted its first “Tech Choice” study. Results were presented today at the Detroit-based Automotive Press Association.

One thing that surprised me: J.D. Power found 59 technologies worth including in their study. Nearly five dozen features that were on few if any cars just a few years ago, but that could all be on many cars just a few years from now.

But which of these features do people really want? The trick with researching demand for new features is that people don’t often realize they want something until they’ve personally experienced it. To overcome this limitation, auto makers sometimes create simulations, so people can experience what a feature will be like before expressing how much they’d like to have it. Unfortunately, J.D. Power had to stick with a low-tech approach: text descriptions of each technology. They couldn’t construct simulations for every technology, so to keep things even across all of them they were limited to text.

Preferred Technologies

With this caveat in mind, they found that car buyers are most interested in collision avoidance technologies, especially blind spot warning but quite open to features like night vision, automatic braking, and even self-driving cars. This was the case for all four generations in the study. People are concerned about the safety of self-driving cars, but if these concerns can be assuaged there will clearly be demand for the technology. Younger drivers also liked the idea of being able to work, sleep, or work off a buzz while being driven.

Respondents also highly preferred self-healing paint and camera-based rearview mirrors. The first was tried by Infiniti for a few years, but was then dropped when the self-healing abilities of the paint couldn’t meet the overly high expectations of car owners. It’s not clear why respondents found a camera-based rearview mirror was so appealing. I suspect an impressive description on the survey, that possibly included the elimination of blind spots. People hate blind spots.

The car owners surveyed expressed little interest in gesture- and haptic-based control systems, Tesla-like hidden door handles, and other unfamiliar convenience features.

A final major finding: people who have Apple phones don’t want Google’s Android Auto, and people who have Android phones don’t want Apple’s CarPlay. Both systems use the car’s infotainment screen to view and interact with phone-based apps. Not included in the study: Mirrorlink, a similar cross-platform system, or car makers’ proprietary car-based apps. All of these aim for similar capabilities. Do car owners really don’t want these, or are they unfamiliar with the possibilities, confused by the number of alternative platforms, or both?

Phone based app platforms

Even if J.D. Power detected little demand for these app delivery systems, a different study by IHS Automotive found widespread global demand for in-car apps. They’re clearly happening, and are already available in many, perhaps most new cars. Who’ll win the platform battle? Probably not the manufacturers, though they provided the only platforms for the first few years. I suspect that in coming years apps will shift from car-based to phone-based, at which point the battle for supremacy will mirror that between Apple and Android phones. Car makers might be struggling now with the question of whether to support either. They’ll end up supporting both.

So, which of these features are you most interested in?

What TrueDelta offers, a recap

I fear that somewhere along the way, as we tried to streamline the site even as we added features, we lost a clear statement of what TrueDelta offers that no one else does. Here I’ll attempt a list.

Car Reliability

1. Promptly updated four times a year, to closely track cars as they age
2. A preview of the next quarter’s update as responses come in, only for participants
3. Actual repair frequencies, not just dots, to indicate how large differences actually are
4. Nada-odds stats, reporting the percentage of cars with no repairs in the past year
5. Lemon-odds stats, reporting the percentage of cars with 3+ repair trips in the past year
6. The same as 3-5, but including only powertrain and chassis repairs
7. Reliability trends graphs, to indicate how a car’s reliability has been trending and to compare model years at the same age
8. These stats continuously cover cars from when they first go on sale up to 15 years old
9. Descriptions of all reported repairs are posted to the site
10. All of the above based on a continuous, prospective survey (others are separate instances and retrospective)
11. Full access to all of the above for free to everyone who helps provide the information

Real-World Fuel Economy

1. Driving mix beyond the overly simplistic city-highway dichotomy
2. Driving style (heavy feet can make a big difference)
3. Driving conditions (cold weather and A/C use can also make a big difference)

Car Reviews

1. Pinpoint the reasons to buy or not buy a particular car, relative to all key competitors
2. Explicitly include at least one key competitor, for a clear reference point

Car Pricing

1. Select features, not less intuitive trim levels (ES, SE) and option packages (Premium Package, Technology Package)
2. Can configure two models with one feature selection, for a very quick applies-to-apples comparison
3. Tabulates value of features not shared by all cars in the result, for a feature-adjusted comparison
4. Members have the option of specifying their own feature values

My Next Car?

1. Ask for suggestions based on priorities, needs, driver types, etc.
2. Quick links to all of the site’s information for the cars members suggest.

Have I left anything out?

Updated Car Reliability Stats, Now With Reliability Trends

Every time we add a new feature, I wish we could have added it earlier (unfortunately, it’s just not possible to do everything immediately). This is especially the case with the latest addition: car reliability trends

Reliability-trends-Equinox

We updated our car reliability stats–for the 34th time–at the end of February. Each of the previous 33 times, our stats have only reflected owner experiences over the past year. They’ve been a snapshot in time, or more specifically of one year in time. You could tell how reliable a car had been recently. But was it getting better or worse? And what did previous model years suggest about its future?

To help answer these questions, we’re now doing something that no source of car reliability information has done before: we’re revisiting past results, up to six years of them, and graphing them to potentially answer many different questions:

1. How a particular model year of a model been getting better or worse?

2. How does this car’s reliability as it has aged compare to other model years?

3. How does this car’s reliability as it has aged compare to other models?

First, consider the graph at the top of this post. It displays reliability over the past five years for five model years of the Chevrolet Equinox (and the related GMC Terrain). Reliability for every model year save the 2012, which experienced a fortuitous dip, has been fairly consistent over time. (Well, at least until the 2010 experienced a severe uptick with the latest update. With the next update, in May, we’ll see if this was a random blip or a dramatic turn for the worse.) The other obvious conclusion: General Motors has dramatically improved the reliability of these cars from model year to model year. The 2011 has been quite a bit better than the 2010, the 2012 and 2013 have been quite a bit better than the 2011, and the 2014 has been extremely reliable so far, with no repairs reported last year.

Continuous improvement is quite common–at least until a car is redesigned. Two cycles of continuous improvement can be discerned in the record of the Honda Odyssey:

Reliability-trends-Ody-2008

The patterns aren’t as clear as they are for the Equinox, but the 2009 and 2010 have usually been more reliable than the 2008, when the Odyssey received some mid-cycle enhancements. But the 2011 has been more troublesome than any of these model years. What happened? The Odyssey was completely redesigned. But Honda then worked the bugs out of the redesigned van, improving it for 2012, then again for 2013 and 2014.

People tend to think of Subaru as a highly reliable brand. And since they were redesigned for 2010 the popular Outback crossoverish wagon and related Legacy sedan have compiled an enviable record:

Reliability-trends-Outback

Notice how much less reliable the previous generation 2008 and 2009 were at the same ages. You might also notice that the 2008 and 2009 have gotten much worse in recent years. Focus on the previous generation cars, a pattern emerges:

Reliability-trends-Outback-2005

Model year after model year, these cars were fairly solid until they turned four. Then various parts started failing, especially wheel bearings and CV joint boots, but also head gaskets. Reliability rankings that placed Subaru near the top? They analyzed only the first three years of ownership.

Will 2010 and newer Subarus similarly take a turn for the worse? Unfortunately, it’s too soon to say. As they near their fifth birthday, the 2010s have gotten a little worse, but remains much more reliable than most earlier model years at this age.

While cars do tend to require more repairs as they age, most do so less dramatically than the Outback. For a car that ages especially well, check the record for the Toyota Prius:

Reliability-trends-Prius-2005

These lines are much more level than the Subaru’s, aren’t they? Even as it nears its tenth birthday, the 2005 Prius requires repairs just a little more often than the average new car. Notice a bump in the 2006’s trend line? I think that’s when many of that year were having problems with their xenon headlights. A single common problem will often produce a bump like this, or even a much larger one.

It’s also possible to compare reliability trend lines for two models. The Honda Odyssey has a stronger reputation than the Chrysler Town & Country. But compare 2011s, and the Honda’s reliability advantage is far from obvious:

Reliability-trends-Chrysler-vs-Ody

But, if you’ve been paying close attention, you might remember something about the 2011 Odyssey: it was an all-new design. The Chrysler was also updated for 2011, but less extensively. Also, these minivans aren’t that old, and Hondas (like Toyotas) tend to have their largest advantage in reliability when older. So, let’s take a look at the 2008s:

Reliability-trends-Chrysler-vs-Ody-2008

Oops, I did it again, just in the opposite direction. For 2008 Honda updated its minivan, but Chrysler totally redesigned the Town & Country. And yet, after years during which the Honda had a huge advantage, the two have been about equally troublesome lately. Let’s try this one more time, with 2009s:

Reliability-trends-Chrysler-vs-Ody-2009

Now there’s the difference we initially expected. But it’s much less clear with many other years. In many cases the Chrysler minivan has been considerably less reliable than the Honda Odyssey at many points in their lives, but at others they’ve been about even. It pays to dig into the specifics. Take a swing at it–select “reliability trends” in the first box–and post a comment if you find anything interesting:

TrueDelta’s car reliability stats

A different sort of truck; should Hyundai build it?

Santa Cruz front quarter

For some time Hyundai has been trying to decide whether to product a pickup truck. Pickups are a large percentage of the North American market, and are highly profitable for the companies with large shares of the full-size segment. But large pickups from Toyota and Nissan have barely dented the market share of the dominant Detroit companies. Could Hyundai hope to do better?

Perhaps the solution is to offer a different sort of pickup. No, not like the Honda Ridgeline. That truck, based on the Pilot SUV with its transverse, car-like powertrain, was positioned too much like a conventional pickup truck, and failed to convince buyers of conventional pickups that it was as good.

Instead, Hyundai has zeroed in on “urban adventurers,” young (or at least young-at-heart) people with highly active lifestyles. They just need to tote their gear, not heavy loads. And they want something more stylish and easier to park than a conventional pickup.

For these urban adventurers, Hyundai has create the Santa Cruz concept. It’ll seat five, but probably isn’t nearly as roomy as the Ridgeline. But it’s also much more stylish than the Ridgeline, and more compact. The bed appears too short to be useful? Well, for larger loads it has a built-in extender that “makes it competitive with conventional midsize pickups” in terms of length, if certainly not maximum payload. The Santa Cruz is intended as a lifestyle accessory, not a work truck.

Santa Cruz bed extender

Given their expressed need to offer more crossovers, because this is the part of the market that is growing, Hyundai must be considering a production version of the Santa Cruz (i.e. toned down styling and smaller wheels). Should they make it?

Note: top photo by Eric Merrill

A redesigned Tacoma not a moment too soon

Taco front quarter blue

For the past decade virtually everyone has let their compact pickups whither on the vine. Ford discontinued its once best-selling Ranger altogether. The problem: it was hard to make money on them. But GM somehow got the business case to work for a new Chevrolet Colorado and GMC Canyon. If they were counting on having the market to themselves, though, it appears they’ll be disappointed.

The segment leader–by default as much as through merit–has been the Toyota Tacoma. The Tacoma was last redesigned for the 2006 model year, and I don’t think it was entirely new even then. Site members who have checked out the Tacoma ad the competing Nissan Frontier have reported that the Toyota felt very dated in comparison–and the Nissan is itself a very old design, dating to 2005.

Taco rear quarter

Well, for 2016 the Tacoma has been entirely redone. The new truck appears far more up-to-date inside and out. Interior materials, though still clearly those of a truck, are much improved. The rear seat in the crew cab seemed slightly more roomy than that in the GM truck. The new Tacoma’s optional engine will be a 3.5-liter V6 with direct and port injection running on the efficient Atkinson cycle. They’re not releasing its power output yet, but promise far better fuel economy than the current Tacoma–not a hard bar to clear. But–unlike the GM trucks–no mention of a diesel option.

Toyota stressed the truck’s strong off-road racing record in its presentation, and both the styling and engineering reflect this heritage. Chevrolet and GMC dress their trucks up with rugged-looking wheels and trim, but are they similarly the real deal?