Nvidia’s “deep neural network” for autonomous driving

Nvidia Drive PX

Nvidia, initially a manufacturer of personal computer graphics cards, has been emerging as a leading provider of hardware and software for autonomous driving. Most, maybe all, of the companies developing autonomous cars have been purchasing hardware from Nvidia, Tesla most vocally. This Nvidia Drive PX circuit board, which became available to auto makers and their suppliers last May, includes two very powerful processors (capable of 2.3 teraflops), twelve camera inputs, and a radar input. The cost? Apparently $10,000, but at this stage it’s intended for use in R&D, not in production cars.

Installed in development vehicles, this system is designed as a “deep neural network” that continuously refines its ability to identify objects and situations. This system extends well beyond an individual car. What each unit learns, and especially its mistakes along the way, will be relayed automatically to Nvidia, which will use this data to continually improve the code, which will then be transferred to the cars in over-the-air (OTA) updates.

So are you excited, or scared?

How would you like your data sliced?

Over the years we’ve added so many different ways to view TrueDelta’s car reliability information that some have flown under members’ radar. Maybe it would help to have a recap?

We started with the number of successfully completed repair trips per year, calculated per 100 cars to remove the decimal.

GMC Acadia reliability 0615

Some people want to focus on problems that can potentially render the car undriveable, so we post the number of powertrain and chassis repairs per 100 cars per year. (One wrinkle: some minor chassis problems are excluded.) Such repairs increase from only about one-third of the total during the first year of ownership to about three-quarters of the total once cars are over eight years old.

GMC Acadia powertrain and chassis reliability 0615

Both of the above stats are averages. They suggest how many repairs the typical car required–generally less, even much less, than one per year–but not what percentage of cars required many repairs or the percentage that required no repairs at all. Since many car buyers (whether they realize it or, as our traffic stats suggest, not) really want to know their chances of getting a really good car or a really bad one, some time ago we added the “nada odds” and “lemon odds” stats, for both all repairs and for powertrain-and-chassis repairs.

GMC Acadia repair odds 0615

It can be informative to know whether the repair frequency of a car has been increasing or decreasing. Sometimes a common problem pops up that produces a temporary blip. To convey this information, we added reliability trends graphs (only for recent model years and the overall repair frequency so far, we’ll be expanding this feature).

GMC Acadia reliability trends 0615

Each of the above can also be displayed as a comparison between models.

GMC Acadia vs Toyota Highlander reliability

Finally, it can be informative to view the repairs behind the stats. So each stat (other than the trends pages) includes a link to view the descriptions of all reported repairs. These pages include pie charts that categorize repairs by problem area and by cost. These charts are based on all repairs reported ever. (I’d like to add similar charts that only include the repairs included in the current stats, but our to-do list is lengthy.)

GMC Acadia problem descriptions

Our data could be sliced other ways as well, but the most appealing of these (such as splitting the sample by miles driven, and trying the separate out the effects of age and miles) would require larger sample sizes than we tend to have. The solution: get more car owners involved. We’re working on this, and hope our members will as well 🙂

“I no longer have the car, I can’t tell you more”

Occasionally a participant in the Car Reliability Survey tells me, “I no longer have the car, but I can’t tell you more than that.” They don’t have to tell me more. I know what this means. The manufacturer (usually Honda, but sometimes some others) has bought the car back because some problem with it could not be fixed despite three or more attempts, meeting the conditions of the state’s lemon law, and the buy-back agreement included a confidentiality clause. To get the car taken off their hands, the owners had to agree not to talk about it. What do you think about this?

On the one hand, the manufacturer gets to protect its reputation–you’ll hardly ever hear of its cars qualifying as lemons and getting bought back. And the car owner no longer has to deal with a troublesome car. Both parties benefit.

On the other hand, the rest of the public might form a false impression about how reliable the manufacturer’s cars really are. Information that could benefit others is kept under wraps. But does the general public have any legitimate interest in the case, or is it entirely between the manufacturer and the car owner?

Dislaimer: I have a personal interest in this, because confidentiality clauses could potentially reduce the accuracy of TrueDelta’s reliability information. But as long as a problem is reported prior to the settlement and we later learn that the car is gone, then the clauses have no impact on our stats.

New car problems: don’t procrastinate

Some problems are difficult for a dealer to fix, perhaps because they are difficult to replicate. If the problem in question is frightening–perhaps the car cuts off in traffic or on the highway for no evident reason–some owners decide to just park the car and deal with it later. If the problem is more minor, the owner might decide to just live with the problem until they have time to take the car to the dealer again. And they never have the time. The problem with waiting too long to get problems resolved (or not): lemon laws only apply for a limited time. Wait too long, and you lose the ability to force (or at least fairly easily force) the manufacturer to buy back a car the dealer cannot fix.

The first step if you have an unresolved problem with your newish car: read your state’s lemon law to learn how long the car is covered, and how many repair attempts and/or days in the shop are required to qualify.

Next, don’t put off taking the car into the dealer. You want them to have to make the required number of repair attempts within the required time period.

Finally, make sure that whenever you take the car in, that the attempt is documented on paper. Too often if there’s no record, a repair attempt doesn’t count for the purposes of a lemon law buy back.

What’s going on with the 2015 VW Golf?

Golf front quarterThe Volkswagen Golf and GTI were completely redesigned for 2015. The GTI reached dealers first, and to date few repairs have been reported for it. The Golf with the 1.8T gas and 2.0 TDI diesel engines has not been so lucky. With this month’s update it looks like they’ll have reported repair frequencies in the 50s (per 100 cars), more than double the 22 for the GTI. (The GTI’s rating is exactly equal to the average for all 2015s.) What’s going on?

I don’t know. Looking at the repair reports, the only problems we have multiple reports for are AC compressor failures and an audio system that changes stations when turned off then on again. There’s a free software fix for the latter, so it doesn’t count in our stats. At any rate, both problems affect all three engines–they’re not powertrain-specific.

Our sample sizes for the 1.8T and TDI still will be a couple short of the minimum–they’ll have asterisks for “small sample size.” But if they were combined for a “non-GTI” stat the sample size would be a healthy one. And with the next update the scores will both be similar, so a combined stat would also be in the mid-50s.

What’s more, Consumer Reports recently updated its stats (based on a survey conducted last April, so the same time period we covered with our May update), and they are reporting the same difference, with the GTI rated “about average” and the Golf rated “much worse than average.” Looking at their system scores, the Golf actually has a better rating for noises/leaks, but a slightly worse one for fuel system. However, even the latter is half-red (good). None of the Golf’s systems receives even a middling score. Yet the overall rating is full black. This happens when no one area is notably troublesome, but there are enough extra issues across all problem areas to make the overall score “much worse than average.” This is consistent with our data, where there is no clear common problem with the regular Golf that might explain why its score is so much worse than the GTI’s.

One possibility: the GTI launched before the regular Golf, and it’s possible that quality checks were more thorough for the early cars. The line was almost certainly running more slowly at the beginning. No repairs were reported for the GTI in calendar year 2014. But two-thirds of the GTIs in the current sample were enrolled during 2015, and while the reported repair frequency is no longer zero it hasn’t shot up dramatically, only from 13 with the May update (covering through the end of the first quarter) to 17 with the August update and about 22 with the upcoming update. It’s still far below the mid-50s.

I’ll continue to pay extra attention to the Golf. For now this must remain an unsolved mystery.

How up-to-date are TrueDelta’s stats? Our timetable.

Other car reliability surveys can spend nearly six months from when their survey starts to when they release any results. I designed TrueDelta’s process to provide stats that can be over a year ahead of others, and are never based on data more than five months old.

Here’s what our quarterly schedule looks like, using the current quarter as an example:

October 1: First email sent for the car reliability survey for the just-completed third quarter. Reminders will be sent each week to those who haven’t responded.

October 12: Members can preview updated stats that cover through September 30th based on incomplete, raw data. Over the next few weeks the data will become more complete and less raw.

October 29: Final reminder sent.

November 5: Initial review of data (over 7,000 new repair entries) complete. Results nearly final.

November 30: By this date we’ll publicly release the updated stats. A month later the cycle will begin again.

Can Lincoln sell “quiet luxury?”

MKX exteriorLuxury cars are an odd market. Cadillac has been trying to out-BMW BMW by producing the fastest accelerating, best-handling, rear-wheel-drive-based luxury sedans. Mercedes-Benz also has been pushing performance and handling more than at any previous time in its storied history. A consensus has been emerging that the C63 AMG is the best among an increasingly large, increasingly capable crowd of BMW M3 competitors. Even Lexus has felt compelled to sell performance, with its F cars (IS, RC, and now GS). Yet how many luxury car buyers will ever remotely approach the capabilities of even the most basic Mercedes-Benz E-Class? Most of their time is spent commuting, after all. Recognizing how most luxury car buyers actually use their cars, and taking advantage of the freedom provided by its relatively low sales volumes to not have to try to be all things to all people, Lincoln has opted to focus on “quiet luxury.” Might this work? Or is there a reason other upscale brands have been pushing performance so hard?

MKZ interior right view 54First off, what is “quiet luxury?” As explained by Lincoln president Kumar Galhotra in a presentation to the Detroit-based Automotive Press Association (APA) today, “quiet luxury” has three key components: elegance, serenity, and effortless power. It’s the opposite of aggressive styling and aggressive performance. It’s quiet in a very broad sense, visual and experiential as well as auditory, not simply the volume of noise inside the car. Ideally, every detail of how the car looks and performs gets tweaked to remove stress points, to make the driving experience flowing, smooth, and calming.

MKX driver seatI experienced a fair amount of this character in the MKZ Hybrid and MKC, and liked both. The new MKX is even more tightly focused around the new philosophy, and the upcoming new Continental will explore it even further. The features of the last will include front seats whose 15 adjustments will include separate right and left cushion angles. Why? Because while driving just about everyone positions their right and left legs differently. A cushion with the same angle for both creates a “stress point.” Even the Continental will be based on a front-wheel-drive platform. Enthusiasts will scoff at this, but a similar basis doesn’t seem to have hurt Audi.

It’s quite possible that the limiting factor won’t be this message, but Lincoln’s perceived status (or lack of it) despite the renewed effort (and investment) being put into its products. Let’s assume that if the message is the right one, then Lincoln’s battered image will mend. Will many current luxury car buyers be receptive to the “quiet luxury” message? Or do even people who’ll hardly ever drive a car aggressively desire an aggressive car and brand image? Lincoln has no plans to launch a performance-oriented sub-brand. But has one become necessary for a luxury brand to be perceived as credible?

Lincoln has opted to focus so intently on “quiet luxury” that we’re about to find out. They hope this will help them increase their annual sales from 100,000 to 300,000. The paradox: if they’re successful, they’ll then likely have to broaden their message like even BMW and Lexus have if they want to continue to grow.

Car reliability survey brand rankings compared

In a recent blog entry, I listed some reasons TrueDelta’s reliability results can differ from those in Consumer Reports. But how much do our rankings of brand actually differ? In instances where they do differ, what is the likely cause?

Consumer Reports bases its brand rankings on the most recent three model years. On TrueDelta, you can specify which model years to base the ranking on. To compare our results with CR’s, I’ve selected 2013-2015.

Car Reliability by Brand 2013-2015

CR brand ranking

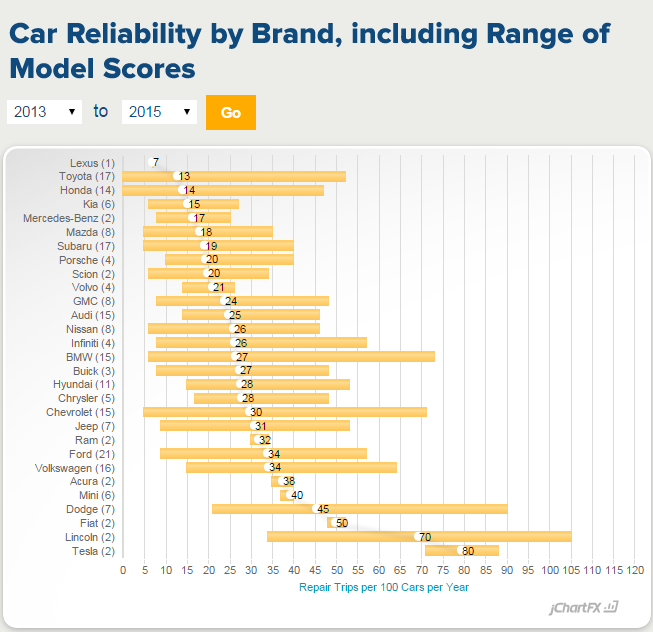
First, the similarities. Lexus, Toyota, Kia, Mazda, and Subaru rank near the top in both surveys. Porsche, Volvo, Nissan, BMW, and Hyundai rank near the average in both surveys. (In TrueDelta’s stats, the average 2013-2015 model requires 25 repair trips per 100 cars per year.) Jeep, Ram, Ford, Lincoln, Acura, Dodge, Fiat, and Tesla rank near the bottom in both surveys (though Tesla isn’t as far from the average in their survey as it is in ours).

We don’t have sufficient sample sizes for any recent Cadillacs. But based on the data we do have, Cadillac would be worse than average in our survey as well as theirs.

Now, the differences.

Hondas score much better in our survey than CR’s. I believe this is because many of the problems reported on CR’s survey involve Honda’s infotainment system, and these are either not fixable (they’re design flaws) or they’re fixable with software. We wouldn’t count these problems in either case.

The same also appears to be the case with Infiniti, but largely involves one model, the Q50 sedan, so the impact on the brand average is lower. Infiniti scores about average in our survey, and well below average in CR’s.

Mercedes-Benz ranks much higher in our survey than in CR’s. This is most likely because they had enough data for six models, while we only had enough data for two, and these two didn’t include the new S-Class or the CLA. The data we do have for the CLA suggests that it is worse than average.

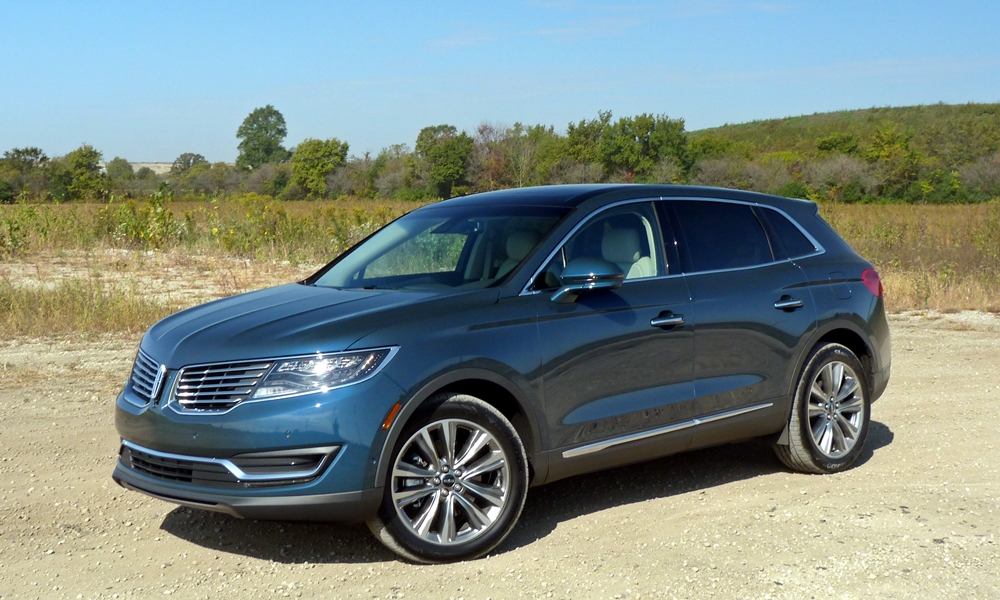
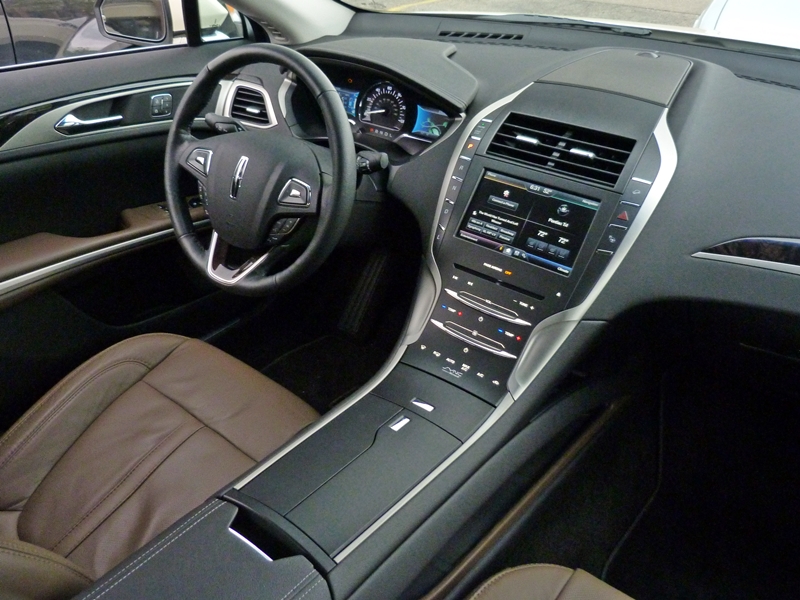
Lincoln is below average in both surveys, but is much lower in ours. This is because we only have sufficient data for two models, and one of the two is the new MKC, which has been troublesome.

For similar reasons, Buick is better than average in CR, but about average in our ranking. We haven’t had sufficient sample sizes for most Buick models. If we included those for which we have partial data, Buick would also be above average in our ranking.

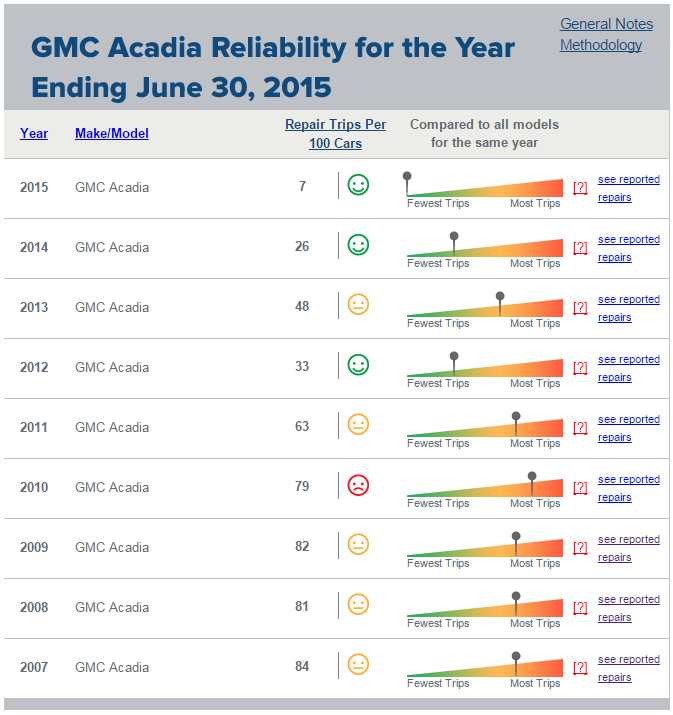
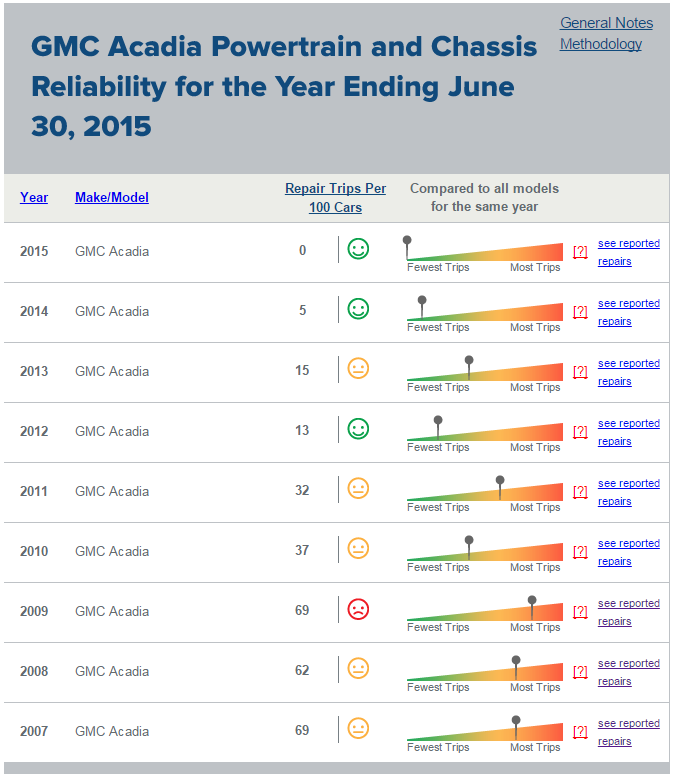
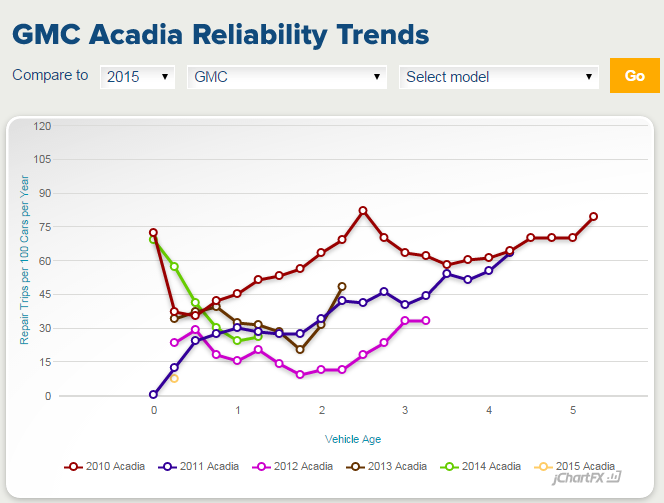
On the other hand, Chevrolet and GMC fare much better in our survey than CR’s. The big difference appears to be with the new pickups and large SUVs. We don’t yet have enough data on the new midsize pickups, but what we do have suggests they’re worse than average. The large pickups and large SUVs, though, have fared far better in our results than in CR’s. Two commonly reported problems could be responsible: shuddering in the new 8-speed automatic transmission, and driver seats prone to shifting when accelerating and braking. A shim kit has been developed to fix the latter, but it’s possible that many owners haven’t had this fix performed yet (CR counts owner-perceived problems, we count completed repairs to be extra-sure there was a problem). The fix for the transmission is updated software, so we would not count these cases.

Chrysler ranks higher in our survey because many of the problems with its latest cars involve transmission and infotainment system software. Dodge, Jeep, and Fiat score even worse in CR’s survey than in ours due to the same factor. But they’re near the bottom in ours even without counting software-related problems.

Audi ranks third in CR’s survey, while it is exactly average in ours. Owner satisfaction could be providing Audi with a boost in CR’s survey. Satisfied owners are less likely to consider a problem serious, and are therefore less likely to report it on CR’s survey. This factor has dramatically boosted Tesla in CR’s survey. This said, the Audi A4 and related models have been doing very well in our survey. We count these as one model. CR might count them as multiple models when calculating the brand score.

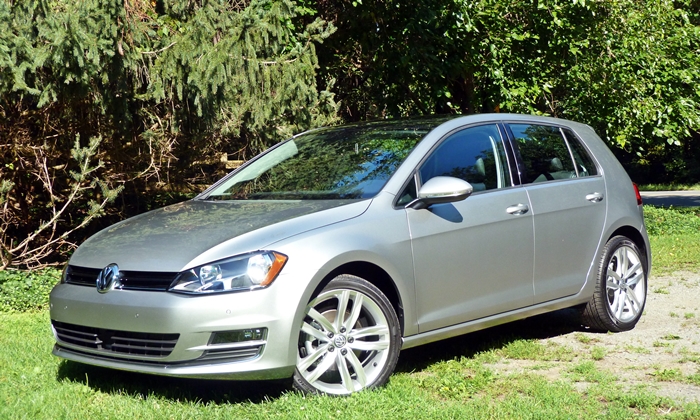
Volkswagen and Mini rank about average in CR’s survey but below average in ours. There’s no obvious explanation. The owner satisfaction factor again? Benefiting from low expectations given how much worse both used to be?

Overall the ranks are more similar than different. Other than Mercedes-Benz, which can be attributed to our lack of coverage, no brand is significantly above the average on one list and significantly below the average on the other.

A Tale of Two Tucsons

Tucson front quarter
Tucson Limited front quarter
Which level of equipment do you tend to be most interested in. Nothing but the essentials? Mid-level, with perhaps leather, nav, and/or sunroof? Or all boxes checked?

I ask because the cars I test can be any of these. The Hyundai Tucson I tested a few weeks ago was the base-level SE. The Mazda CX-3 I have this week is the mid-level Touring. Others have been fully loaded.

One thing that bugged me about both the Tucson and CX-3 is that they lacked higher trim levels’ larger wheels, and so don’t look nearly as good as they could in my photos. Which wheels would you want on your car, the ones with less expensive, harder-to-damage, softer-riding tires, or the ones that handle the sharpest and make the car look its best?

Responsibility and Car Recommendations

From Forbes, August 27, 2015:
Forbes CR Tesla couldnt waitIn late August, Consumer Reports announced that the Tesla Model S was such a good car that it had broken the highly influential organization’s ratings scale with a road test score of 103 out of 100, and reaped a PR bonanza for both Tesla and themselves. If you missed the story, you must have been in a coma. Tesla’s stock price received a nice bump. Two months later, Consumer Reports had to retract its recommendation for the high-performance electric car, as the Model S scored worse than average (and very nearly much worse than average) in the latest round of its reliability survey. Tesla’s stock price received an ugly haircut. Most of the data for the survey was actually collected back in April. Consumer Reports could and should have known that they’d have to withdraw their recommendation in October well before August. Given this, should they have so enthusiastically publicized the outstanding test performance of the Model S in August? Thinking more broadly, what responsibility to car reviewers have to draw on the full breadth of their knowledge, and not only what information has been publicly released, when making car recommendations?

First, the details on Consumer Reports’s annual cycle, as few people have been aware of it. For years they’ve mailed (or emailed) their car reliability survey to subscribers in April, publicly released the results six months later, in late October, and then repackaged the results (now based on data nearly a year old) with their latest road test scores for an April annual auto issue (actually published in late February). This year for the first time all of their surveys were conducted online–no more paper sent via snail mail. This came at a cost: their sample size declined from well over a million to a still impressive 740,000. But fully electronic data should deliver substantial benefits in the cost and speed of data processing and analysis. From my experience conducting TrueDelta’s survey, I’m aware that they could have starting calculating scores based on the raw data back in April–a middling server could have accomplished the task in a couple of minutes. Going fully online can also dramatically shrink the lag between when the surveys start and when the results were released. At TrueDelta, this lag is at most two months. CR did not alter their cadence this year, but I’d be surprised if they do not in future years. Given that the reliability of cars changes as they age, minimizing this lag means minimizing the amount of time you could be providing accurate recommendations, but in some cases are not.

While late responses and checking the data for errors would lead to changes between any preliminary results and the official results released six months later, the changes would not have been enough to move Tesla’s score from within 20 points of the average (necessary for a CR buy recommendation) to the 43 points below average where it ended up. In the great majority of cases, even with sample sizes much smaller than CR’s, the change between initial and final results will be minimal. This is why TrueDelta starts permitting members to preview the next set of results, based on raw data, just a couple weeks after the surveys start, about a month before they new results are virtually final, and about a month-and-a-half before they are publicly released.

I don’t influence millions of car purchases the way Consumer Reports does. I certainly don’t influence stock prices. But through the site and through my personal communications (I get emails..) I do influence more than a few, and I take each one seriously. If I think it is likely that a car’s reliability rating will probably be changing in the future, should this influence my recommendations? Or should I base these recommendations only on the information TrueDelta has already publicly released? In the Tesla case, what should Consumer Reports have done? Should it have waited?